
Most issues with Replication are detailed in either the Replication Monitor or in the history of the jobs used to run the Replication tasks. The following examples are based upon the Pull Subscription detailed in earlier articles.
Replication Monitor
This tool is available to anyone who is a member of the sysadmin role or replmonitor role. It is loaded from any SQL Server instance that has Replication enabled, although life is easier if you launch it from the Publisher or Distributor (anywhere else and you may have to configure it to look for the correct servers).
Within SSMS Object Explorer, right-click on ‘Replication’ and select ‘Launch Replication Monitor’, which will result in:

In the screenshot above the tree structure in the left window has been expanded. The highest level is the Distibutor, expand that and beneath it is the Publisher and beneath that is the actual Publication.
Select the Distributor and three tabs are available in the right-hand pane – ‘Publications’, ‘Subscription Watch List’ and ‘Agents’.
Publications shows the Publications that this Distributor is responsible for, providing the Publisher name, Publications name, the number of Subscriptions and basic performance data.
Agents shows the various Agents that can be involved in Replication. In this Publication select ‘Merge Agent’ will show nothing, because it isn’t a Merge Publication and selecting ‘Snapshot Agent’ will show a status of ‘Never Started’ because snapshots are not used with Publication. Other selections will show the status of various Agents and jobs connected to this Distributor.
Subscription Watch List is the tab probably used most often. Double-click on the entry in the right-hand window and another window pops up, providing a detailed history of that Publication:

There are three tabs in this control and the most important of these tends to be the ‘Distributor To Subscriber History’ tab. As a default it shows the last 100 synchronisations (in this Publication there is one synchronisation every minute) but can be changed by using the drop-down at the top of that tab.
To show what should normally happen with this tab clear the Subscriber table, generate 1000 rows of data within the Publisher and watch this screen as the data is Published across.
For ease, Redgate SQL Data Generator has been used to insert the 1000 rows. From the current display on that tab you can see that it normally refreshes at roughly 30 seconds past each minute, so once it is due press F5 to refresh the screen and the message can be seen giving basic details of what was Published from the Distributor to the Subscriber:

Errors within the Publication
Now repeat the insertion on the Publisher, having truncated the table on the Publisher first it will generate Primary Keys that already exist on the Subscriber. This of course, will not go down well when the data gets to the Subscriber.
Initially the History will show that there is a problem and it is going to retry the individual commands, instead of the entire batch in one go:

A short while later it gives up and provide a detailed error message:
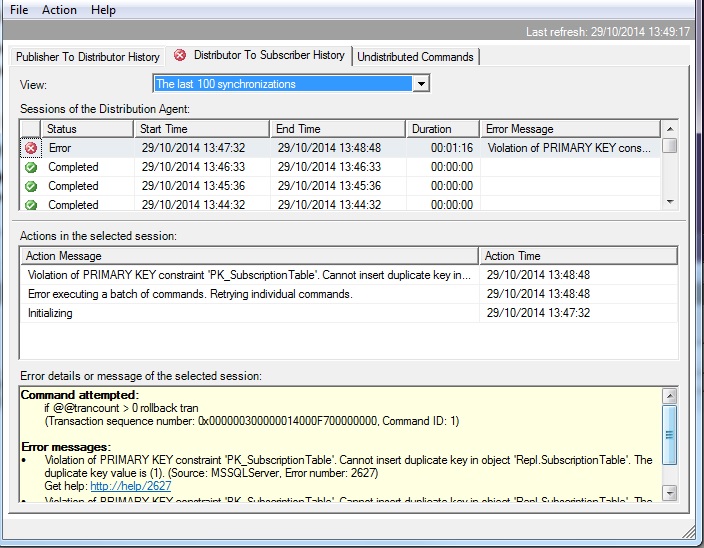
In this case it is informing of a violation of the Primary Key constraint, as that PK already exists on the Subscriber. This series of retrying and error reporting will repeat until something is done about it. In this case remove the data from the Publisher that already exists with the Primary Keys being Published and all will return to normal:

Another way to use this tool for locating the problem is in the Error Details part of the screen, with the Transaction Number displayed.
To show what can happen if the customised Stored Procedure is wrong, within the Subscriber change the SP ‘dbo.sp_MSins_Repl_SubscriptionTable’ to remove reference to th ‘PK’ column, which is NOT NULL.
USE [SubscriberDB]
GO

ALTER procedure [dbo].[sp_MSins_Repl_SubscriptionTable]
    @c1 bigint,
    @c2 varchar(50),
    @c3 date,
    @c4 datetime
as
begin
	insert into [Repl].[SubscriptionTable](
		--[PK],
		[EmailAddress],
		[DOB],
		[DateCreated]
	) values (
    --@c1,
    @c2,
    @c3,
    @c4	)
end
Of course, any attempt to write a row to this table via this SP now will result in an error. The trick is to work out what command is failing within replication.
On the Publisher, execute the following:
USE [PublisherDB]
GO

INSERT INTO [ReplTest].[PublicationTable]
           ([EmailAddress]
           ,[DOB])
     VALUES
           ('test@test.com'
           ,'01 Jun 1970')
GO
Initially it will retry the command, as before. Eventually it will show an error message, along with the Transaction Sequence Number:

That binary number is used to run a query against the Distributor database to get the data it is attempting to send. The query is ‘sp_browsereplcmds’, with two parameters – both are the binary value taken from the Replication Monitor:

If multiple rows are returned from this query then the required row is the one where ‘command_id’ matches ‘Command ID’ shown in the error message from Replication Monitor (although you should check the column ‘partial_command’, as the query might be split across several rows).
From the column ‘command’ we can see the call to ‘sp_MSins_Repl_SubscriptionTable’ along with the parameters used.
Copying the contents of this column to SSMS and running it against the Subscriber (with a minor amount of editing to keep SSMS happy) shows the error:

Now we have the command that is causing the issue and the parameters it is using. In this case it’s obviously a fault within the SP, so simply amend it back to save the PK column and all returns to normal.

Tokens
Another basic way to check Replication is all connected up is to run a Tracer Token through it. A Tracer Token is just a small amount of data written to the log of the Publisher and then tracked through the Publication.
To run a Tracer Token through Replication Monitor go to the bottom of the tree structure in the left-hand window, selecting the Publication. Three tabs appear and one of these is ‘Tracer Tokens’. Select that tab and press the button ‘Insert tracer’.

The time for ‘Publisher to Distributor’ will generally be within a few second, as that part of the Publication is configured to run constantly. ‘Distributor to Subscriber’ can take a while, depending upon when that job is scheduled. In this Publication it is once every minute, so could take anywhere up to one minute to complete. Once completed it shows the total latency and is an indication that the connections are configured correctly for the three main elements (Publisher, Distributor and Subscriber) to communicate correctly.

Nice article Steve
Work more with Always On these days but like to keep my hand in by reading well written, informative posts like these.